“Gratitude is not only the greatest of virtues but the parent of all others”
–Marcus Tullius Cicero, Roman Philosopher (106 BC–43BC)
Volume 23
The Bull Market Marathon: Are We Still Going Strong?
What Happened in the Markets


Subscribe and start receiving the Atlas Memo directly to your email

Imagine a marathon runner at mile thirteen—past the early sprint but still with energy to burn. That’s where we find today’s bull market: not at the starting line, but far from out of breath. As we look ahead to 2025, chatter about this market’s stamina has grown louder. Is it ready to collapse, or are there miles left in the tank? Here at Atlas, we’re taking a methodical approach using economic fundamentals and history, leaning on the timeless adage that history doesn’t repeat itself but often rhymes.
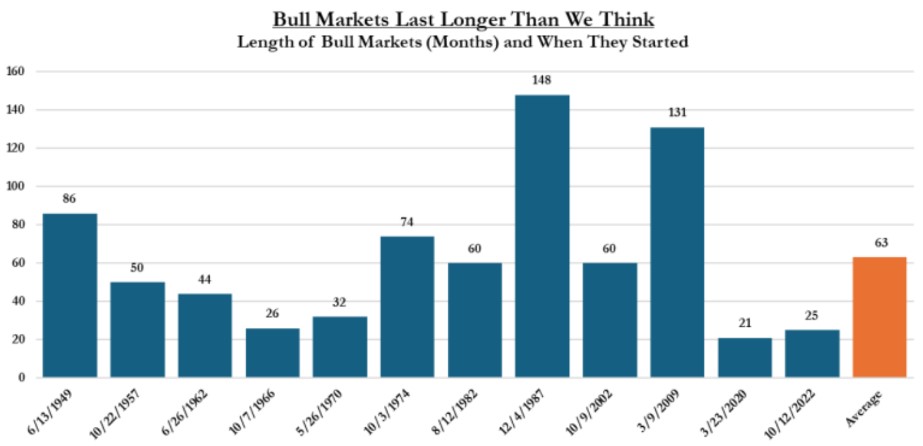
By examining past bull markets, we aim to uncover patterns that can guide our understanding of the current one. Since 1950, there have been twelve bull markets, defined as periods when stock prices climb by at least 20% over two months or more. These upward trends last, on average, five years, as shown in the chart below.

Consider these two exceptions to the five-year average: the bull markets of 1966 and 1970, each prematurely halted by a mix of economic headwinds and tightening monetary policy.
In 1966, the Federal Reserve raised interest rates to combat inflation caused by significant government spending on the Vietnam War and various domestic programs. This decision put pressure on corporate earnings, leading investors to favor bonds over stocks, which ultimately ended the market rally.
By 1970, a recession had taken hold due to prolonged monetary tightening, fiscal imbalances, and rising war costs, which strained the economy. The combination of rising unemployment, slowing GDP growth, and emerging stagflation undermined investor confidence, abruptly ending the bull market. As of 2024, we are not facing similar situations that ended these bull markets.
In more recent history, in 2022, inflation briefly halted the post-COVID recovery. The Federal Reserve’s aggressive rate hikes soon stabilized the markets, giving birth to our current bull in October of that same year.
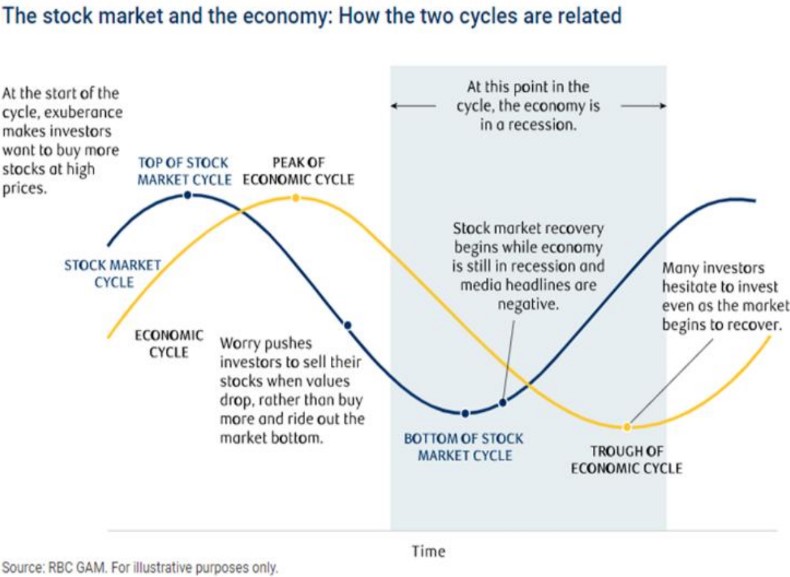
It’s crucial to distinguish between stock market cycles and economic cycles. RBC aptly describes this relationship: while the stock market (the blue line) is forward-looking and anticipates economic shifts, the economy (the yellow line) reacts more slowly.
At the peak of a stock market cycle, investor optimism is high, even as the economy grows. This exuberance can lead to inflated stock prices as investors eagerly buy in hopes of continued gains.

In contrast, during a market trough, sentiment plummets, and stock prices reach their lowest levels due to fear and uncertainty. This decline often happens before the economy starts to recover, showing that the market typically reacts ahead of economic trends.
This lead-lag relationship illustrates the stock market’s remarkable capacity to anticipate future events, often amplifying both positive and negative news. For instance, good economic reports can lead to an overreaction in stock prices, while bad news can lead to panic selling.
Psychology significantly influences investor behavior, with emotions like fear and greed driving decisions. In times of optimism, greed leads to excessive buying, while fear during downturns can cause panic selling, further lowering stock prices. These emotional factors create market cycles, highlighting the interplay between sentiment and economic conditions.
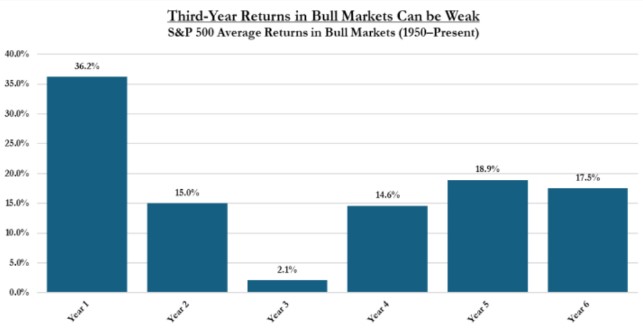
At just over two years old, the current bull market has the potential for further growth if historical trends hold. On average, year three of a bull market tends to be rockier than others (see below), and with 2025 on the horizon, we anticipate some turbulence. Political transitions, evolving fiscal policies, and global uncertainties will undoubtedly influence market behavior.

Still, the broader economic indicators remain encouraging. As noted throughout the year, the US economy has shown resilience, even amid headline driven volatility. While GDP growth, labor market strength, and corporate earnings suggest that this bull market still has room to run.
Every investment decision we make relies on a mosaic of data points—economic fundamentals, historical trends, and forward-looking insights. Each tile may seem insignificant on its own, but together, they reveal a cohesive picture. This is how we analyze markets: with patience, perspective, and a commitment to understanding the whole.
As we approach 2025, we will diligently track the evolving landscape and stay nimble in our approach to adapt to any changes in market conditions. Although we anticipate encountering unique challenges on this journey, we are optimistic that the prevailing bull market possesses significant potential for sustained growth and expansion. Our commitment to being responsive and proactive will guide us as we navigate the complexities of the economic environment.
After experiencing the second-worst monthly return of 2024, November delivered an exceptional turnaround, emerging as the best performing month of the year.
The S&P 500 led the charge with an impressive 5.8% gain, but small-cap and mid-cap stocks outshined even that, boasting remarkable returns of 11.0% and 8.7%, respectively.
In contrast, international markets faced headwinds. Developed markets struggled, declining by -0.7%, while emerging markets fared slightly worse, down -2.5% for the month.
Fixed income markets delivered modest results. US investment-grade bonds, including Treasuries, posted returns of 0.8%, while the
broader US Aggregate Bond Index returned 1.1%. On the higher yielding end, bank loans and high-yield bonds performed 1.0% and
1.2%, respectively.
Overall, November was a standout month for US markets, driven by strong corporate earnings, a robust economy, a resilient labor market, and solid consumer spending.
As the Chief Investment Officer, Stephen Swensen oversees investment management, research, portfolio design, and all investment-related operations at Atlas. He also chairs the Atlas Investment Committee, guiding strategic investment decisions.
Stephen’s career began as a Financial Analyst for Deseret Mutual Benefits Administration (DMBA), a role in which he managed investments for a private pension fund and insurance company. Subsequently, he served as an investment analyst and portfolio manager for local Registered Investment Advisors (RIAs). Before joining Atlas, Stephen contributed his expertise as an Outsourced Chief Investment Officer (OCIO) for the Carson Group, supporting advisors on the West Coast. Educationally, Stephen holds an MBA and an MS in Investment Management and Financial Analysis from Creighton University. He has earned the Series 65 Uniform Investment Advisor License and is actively pursuing the prestigious
Chartered Financial Analyst (CFA) designation.
Beyond his professional achievements, Stephen is an enthusiastic hockey fan, both on and off the ice. He finds joy in playing the piano, golfing, reading, and outdoor cooking. However, his greatest source of happiness comes from spending quality time with his wife and four children

NOTICE REGARDING INVESTMENT DISCLOSURES: The contents of this memo reflect the opinions of the author(s) as of the indicated date and are subject to change without notice. Atlas Investment Management has no obligation to update the information provided here. It should not be assumed that past investment performance guarantees future results. Potential for profit also entails the risk of loss.
The information presented is believed to be current and is not personalized investment advice. All opinions expressed are as of the date of the presentation and may change over time. All investment strategies carry the potential for profit or loss. Asset allocation and diversification cannot guarantee improved returns or eliminate the risk of investment losses. Target allocations may deviate due to market conditions and other factors. There is no guarantee that any investment or strategy will be suitable or profitable for an investor’s portfolio. Different types of investments involve varying levels of risk.
The charts and slides do not depict the performance of Atlas Investment Management or any of its advisory clients. Historical performance returns for investment indexes and/or categories typically do not factor in transaction and/or custodial charges or an advisory fee, which may decrease historical performance results. There is no assurance that an investor’s portfolio will match or exceed a specific benchmark.
This communication, including any attachments, is intended exclusively for the addressee and may contain proprietary, confidential, or privileged information. Unauthorized use, copying, disclosure, dissemination, or distribution is strictly prohibited. If you are not the intended recipient, please immediately notify the sender by return email, delete this communication, and destroy all copies.
Securities are offered through Purshe Kaplan Sterling Investments, Member FINRA/SIPC, headquartered at 80 State Street, Albany, NY 12207. Investment Advisory services are offered through Ignite Planners, LLC. Purshe Kaplan Sterling Investments and Ignite Planners, LLC are not affiliated companies. Ignite Planners, LLC conducts business only in states where it is properly registered or is excluded or exempted from registration requirements. SEC registration does not constitute an endorsement of the firm by the Commission and does not imply that the advisor has achieved a particular level of skill or ability. All investment strategies carry the potential for profit or loss.