
Written By: Stephen Swensen
Date: Tuesday, November 11, 2025
Subject: The Illusion of Liquidity: Mispricing Risk in Public and Private Markets
In an earlier whitepaper, The Importance of Liquidity in Investment Portfolios, we explored why maintaining access to liquid assets provides flexibility, control, and resilience across market cycles. Yet not all liquidity is what it appears to be. Some assets only appear liquid until stress reveals their fragility, while others seem stable merely because they are not marked to market. This paper continues that conversation by examining how liquidity illusions arise in both public and private markets, why these misconceptions lead to mispriced risk, and how investors can better manage liquidity exposure across portfolio structures.
Liquidity illusion refers to the deceptive appearance of ample liquidity in an asset or market that may vanish under stress. In other words, investors perceive an asset as straightforward to trade at a stable value—until a crisis reveals that trading can freeze or prices can plummet. A prominent example is in exchange-traded funds (ETFs): during normal market conditions, investors can readily buy or sell ETF shares, creating the illusion of deep liquidity. However, regulators and analysts warn that this liquidity can “easily disappear in the context of a crisis—exposing investors to significant losses and an inability to sell their shares”. Similarly, in private markets, illiquidity can masquerade as stability. Private funds often report steady net asset values (NAVs) with minimal day-to-day volatility, creating an illusion that these assets are low-risk and insulated from market turmoil. In reality, the risk may be hidden. When investors eventually seek to withdraw or when actual market values are forced to come to light, the lack of liquidity becomes painfully apparent.
Why It Matters: Liquidity illusion is dangerous because it lulls investors into underestimating liquidity risk. In public markets, investors might assume they can exit positions quickly at fair prices, not planning for the scenario where buyers disappear and prices gap down. In private markets, investors might assume their capital is safe due to smooth NAVs, not realizing that those values could drop if assets were sold. This complacency leads to mispricing of liquidity premiums (the extra return demanded for holding illiquid assets) and can amplify shocks. When the illusion breaks, the scramble for liquidity (“dash for cash”) can lead to fire sales and systemic stress. For instance, the post-2008 environment of low interest rates led many to chase yield in less liquid assets under the assumption that central banks would keep markets liquid. This dangerous illusion is now unwinding. As one analysis notes, markets in recent years have tended to underprice liquidity risk, making the financial system more sensitive to shocks. In short, liquidity illusions lead to liquidity premiums being mispriced, which could mean investors are not being adequately compensated for the real liquidity risk they bear.
Liquidity illusion manifests differently in public and private markets. In public markets (such as stocks, bonds, and ETFs), it takes the form of apparent immediate liquidity—tight bid-ask spreads and active secondary trading—that can suddenly evaporate in a crisis. Markets that seem deep (even for typically liquid assets like government bonds or blue-chip stocks) can seize up when everyone rushes for the exits at once. In private markets (such as private credit or private equity funds), liquidity illusion manifests as apparent stability—asset values fluctuate minimally and investors face infrequent opportunities to redeem. This creates a sense of safety (“no volatility!”) until one day the fund halts redemptions or marks down asset values. In essence, public-market liquidity illusion is “you can always sell—until you can’t,” whereas private-market liquidity illusion is “these assets never go down—until they do.” Both lead investors to misjudge risk. As veteran investor Cliff Asness quipped, for too long, only wealthy investors in illiquid alternatives have been able to “fool themselves into thinking their investments aren’t volatile” by hiding behind infrequent pricing. The following sections explore how these illusions manifest in ETFs versus private credit, examine why the traditional concept of a liquidity premium may be outdated, and discuss the implications for portfolio strategy.
ETFs are often touted for their liquidity. Investors can trade ETF shares throughout the day on an exchange (the secondary market), and authorized participants (APs) can create or redeem shares via the ETF issuer for underlying assets (the primary market). This dual-layer structure ostensibly provides abundant liquidity: investors can either find a buyer for the ETF share or rely on APs to arbitrage any price/NAV discrepancies by exchanging shares for the fund’s underlying asset basket. Under normal conditions, ETF shares trade very close to their NAV, and large volumes can change hands easily. This has led to a perception that even traditionally illiquid exposures (e.g., high-yield bonds, emerging market debt) become liquid when packaged in an ETF. Indeed, ETFs are often used by asset owners as “liquidity sleeves”—a placeholder for quick cash needs—under the belief that they can be sold on short notice without significant price impact.
The liquidity of an ETF is only as good as the liquidity of its underlying assets and the market makers’ willingness to transact. In benign markets, ETFs appear liquid because APs and dealers can readily arbitrage and inventory the underlying securities. However, in a stressed market, two things tend to happen: underlying market liquidity dries up and APs step back. When the underlying bonds or assets aren’t trading (or have wide bid-ask spreads), it becomes riskier and more costly for APs to perform arbitrage. They may demand wide spreads or stop creating/redeeming shares, breaking the mechanism that typically keeps ETF prices aligned with their NAV. At the same time, panicked investors in the secondary market may be selling the ETF shares en masse, causing the ETF market price to drop below the last-published NAV. This scenario played out in March 2020: amid the COVID-19 market panic, corporate bond ETFs traded at steep discounts to their net asset values. The BIS reported that the prices of many corporate bond ETFs dropped noticeably below the value of their portfolios, reflecting the relative illiquidity of the bonds—NAVs were stale and didn’t yet reflect how far bond prices would fall once trades occurred. In mid-March 2020, major bond ETFs like LQD (investment-grade corporate) and HYG (high-yield corporate) saw their market prices fall 5–10% below NAV. Some high-yield ETFs at times traded at 20%+ discounts as sellers overwhelmed the market and dealers pulled back. (Market-makers were understandably reluctant to buy more bonds that “nobody wants,” as one analysis noted, leading to a feedback loop where illiquidity in a few bonds begot illiquidity in the ETF and vice versa).
Stress-Tests Case Studies: The March 2020 episode is a hallmark case of ETF liquidity illusion. Bond ETFs were supposed to provide “on-demand” liquidity, but when credit markets froze, the ETF prices discovered that the underlying bonds were worth much less than the last quotes. Investors who thought they could easily sell their bond exposure via ETFs were faced with either holding through turmoil or accepting a steep discount. Industry proponents argued that the ETFs were actually providing price discovery (since many underlying bonds weren’t trading at all), and that the NAV lag—not the ETF—was the illusion. There is truth to the price discovery argument, but from the investor’s perspective, the result was the same: in a crisis, the “liquidity” was one-sided—you could sell, but at fire-sale prices. The dislocations grew so severe that the Federal Reserve intervened, establishing facilities to buy corporate bonds and even buying bond ETFs to restore market function. This backstop caused discounts to narrow significantly by late March 2020. Still, the lesson was stark: ETF liquidity is not endless; it can evaporate without a buyer of last resort.
Another example came in September 2022 in the UK gilt market. UK government bonds (gilts) are ordinarily very liquid instruments. Yet when a spike in yields (triggered by a policy shock and pension funds’ derivative margins) led to forced selling, even gilts saw their market liquidity collapse. Yields surged in a matter of days, and trading became significantly dislocated. The Bank of England noted that during the height of the sell-off, “selling pressure in gilt markets…led to evaporating market liquidity, especially in long-dated gilts”. Bid-ask spreads blew out and transaction costs “quickly soared”, with the dispersion in prices across trades more than doubling as the market became disorderly. In essence, even the UK gilt market faced a sudden liquidity vacuum—a shocking development for a G7 sovereign bond. The BoE had to step in as a buyer to stabilize the market. While this episode did not involve an ETF per se, it illustrates the same illusion: an asset assumed to be highly liquid can abruptly become untradeable at a rational price when stress hits. Notably, some UK bond ETFs and funds likely struggled during this turmoil as well, underscoring that public-market liquidity often depends on confidence and intermediary balance sheets, which can vanish overnight.
These cases show that ETF liquidity can be fragile. The apparent ease of secondary-market trading and the creation/redemption mechanism can give way to fragility under duress. Market makers are not obligated to make markets in extreme conditions. If volatility is high or the underlying market is “dysfunctional,” they will protect themselves by widening spreads or withdrawing from the market. As a result, an ETF’s defining liquidity feature can “disappear in a stressed situation”. The ETF might carry a reputable brand name, but in a crisis, the crucial factor is whether anyone is willing to absorb risk and arbitrage prices. In March 2020, many dealers hit their risk limits and were unwilling to provide bids on illiquid bonds, so ETF shares traded on the exchange like a hot potato—at whatever price cleared the next seller. This is essentially a liquidity illusion bursting: investors who assumed they could always cash out discovered that liquidity is a fair-weather friend. As a financial blog put it, the ETF market “works until it doesn’t,” and wasn’t really “designed for a large market sell-off”. When underlying assets become illiquid and lose value, ETF holders rushing to sell will find that the “liquidity mismatch” between the fund and its assets can lead to a vicious circle (forced selling driving prices even lower).
In summary, ETFs offer convenient liquidity in normal times but can serve as a conduit of stress during adverse times. The “liquidity transformation”—taking illiquid assets and wrapping them in a tradable shell—creates a classic liquidity illusion. As the BIS observed, ETF prices are far more reactive and volatile in a crisis than the underlying asset values, precisely because the underlying markets are slow or frozen. In effect, the ETF reveals the actual market-clearing price (often significantly lower), which long-term holders must eventually reckon with. The takeaway is that ETF liquidity = liquidity until it isn’t. Investors must not be complacent about the ease of exit; in stressed markets, selling an ETF can be just as hard as selling the underlying assets—or even harder, if everyone rushes to do it simultaneously and “doors” get crowded. What appears to be a deep pool of liquidity can suddenly turn into a shallow puddle when the tide goes out.1
Private credit has surged in popularity as investors seek higher yields and diversification away from public markets. Private credit funds, such as direct lending funds, private debt funds, or private Business Development Companies (BDCs), typically make loans to mid-sized companies that are not accessible through public bond markets. A defining feature is that these funds do not offer daily liquidity. Instead, they typically lock up investor capital for several years or offer only limited periodic redemptions. Many are structured as closed-end funds with a multi-year lifespan (e.g., a 5-7 year fund that distributes proceeds only as loans are repaid or sold). Others are “evergreen” or perpetual funds that allow some withdrawals on a quarterly or semiannual basis, often with strict limits (for example, no more than 5% of the fund’s NAV can be redeemed in a quarter—a gate that slows the outflow). Fund managers promote these vehicles as offering consistent income with low volatility. Indeed, one of the selling points to high-net-worth and institutional investors is a “stable NAV”—the fund’s reported value per share changes little from month to month, unlike a publicly traded bond or loan fund that would fluctuate daily. By holding loans at cost (adjusted only occasionally for credit events or modest markdowns), private credit managers can report very steady performance (e.g., minimal drawdowns, a near-zero standard deviation in monthly returns). This optics of stability appeals to investors who dislike market volatility. However, it can mask significant liquidity and valuation risk beneath the surface.
Limited Redemption, Concealed Liquidity Risk: Private credit funds often engage in liquidity transformation of a different kind than ETFs. Rather than offering instant liquidity (which they cannot, given illiquid assets), they provide limited liquidity with an illusion of stability. For example, an open-ended private credit fund might allow investors to redeem a small portion (say 5-10% of the fund) each quarter. Under ordinary market conditions, the trickle of redemptions can be met from interest income, portfolio cash flows, or occasional loan sales. Investors thus assume they can withdraw their money within a year or so if needed. In the meantime, the NAV remains relatively constant (loans are carried at par unless a borrower’s credit deteriorates significantly). The liquidity illusion here is the belief that the fund’s lock-up and limited redemptions are enough to avoid any problems—that you can always redeem slowly, and the NAV will barely budge. This illusion can persist because, unlike public funds, private funds don’t have to sell assets at the first sign of trouble; they can wait and hope for prices to recover. However, the risk comes when many investors suddenly demand liquidity, or when the loan assets themselves face distress.
Suppose a private credit fund faces large redemption requests (e.g., investors panic after seeing economic trouble). In that case, it has a few choices, none of them pleasant: (1) sell a chunk of its loans in the secondary market to raise cash, (2) borrow against its assets (if credit lines are available) to meet redemptions, or (3) invoke gate/suspension provisions to halt or limit withdrawals beyond the standard caps. Option (1) can be problematic because the secondary market for private loans is often shallow—finding buyers quickly may require selling at a significant discount (perhaps 80 cents on the dollar or worse, depending on market conditions). That would force the manager to mark down the NAV, breaking the illusion of stable value. It also hurts remaining investors, as the fund realizes losses. Option (2) (borrowing) can only go so far and can introduce leverage risks. Therefore, many private funds resort to option (3): shutting the gate—effectively saying to investors, “you can’t have all your money now; try again later.” By deferring or denying redemptions, the fund avoids fire-selling assets at distressed prices—but at the cost of trapping investors’ capital until conditions hopefully improve.
The fundamental issue is a liquidity mismatch. Private credit loans are highly illiquid assets—they are not traded on exchanges, often have no active market, and may take months to refinance or sell. Yet some funds promise periodic liquidity to investors (even if limited). In benign times, this mismatch is managed by strict limits and the fact that not everyone tries to leave at the same time. But in a sustained period of stress, those limited redemptions themselves could become a channel of instability. The U.S. Financial Stability Oversight Council (FSOC) pointed out that while most private credit funds lock up investor capital for extended periods (mitigating run risk), the growth of “semi-liquid” structures is a concern. Semi-liquid perpetual funds and private BDCs do offer periodic redemptions, which “could contribute to liquidity risks in a sustained period of stress”. In other words, if market conditions are unfavorable and many investors want to exit (sustained outflows), even a quarterly or annual redemption facility can be too much of a promise in terms of liquidity. The fund might meet one wave of redemptions. Still, if selling assets at decent prices becomes impossible, it will have to either drastically delay further withdrawals or dump loans at fire-sale prices, each of which has systemic implications. The IMF’s 2024 Global Financial Stability Report echoes this, noting that the great majority of private credit funds have little liquidity mismatch (due to being closed-end), “yet the growth of semiliquid funds could raise concerns”. These new structures (often aimed at retail or smaller institutional investors) blur the line by offering a bit of liquidity from fundamentally illiquid portfolios.
Stable NAV—Feature or Bug? The stable NAV and infrequent marks in private credit are both a benefit and a drawback. On one hand, they prevent panic—investors don’t see big swings and therefore may not rush to redeem at the worst time. The volatility smoothing can encourage a long-term mindset. (It’s the classic argument that private assets keep you from seeing the volatility, so you don’t act on it). On the other hand, this stability is partly an accounting fiction—it relies on not having to sell assets. As Cliff Asness remarked, big multi-year illiquidity and pricing opacity can be a “feature, not a bug” for investors who want to ignore short-term turmoil. It effectively tricks them into thinking risk is lower. But if the emperor has no clothes—i.e., if one had to liquidate the portfolio quickly, the actual volatility would reveal itself—then investors may be overpaying for that illusion of safety. Asness recounted a telling anecdote: during a market crash, his private equity colleague reported their portfolio was “about flat”. In contrast, public markets were down big, casually admitting that if they “had to sell” that day, they’d get “way less”—but they didn’t have to sell. This sums up the stable NAV illusion: we’re not down because we choose not to measure or realize the loss. It works until you have to sell (or until the losses accumulate to the point where valuations are finally adjusted).
In practical terms, private credit managers use tools that can delay loss recognition: for example, if borrowers struggle, loans might be modified or given PIK (payment-in-kind) interest, which accrues to principal (thus avoiding a default). The FSOC noted rising use of PIK interest in BDCs, warning that it can “mask underlying credit problems and delay recognition of loss”. By keeping loans on accrual status and not writing them down, a stable NAV is maintained… until it isn’t. If the economy worsens and actual defaults materialize, those losses will ultimately impact NAV. However, in the interim, investors may be shielded from bad news—a classic liquidity illusion that equates stability with safety. In reality, the risk is merely being stored up.
The actual test of these private credit structures will come in a severe credit downturn or recession. Will investors accept gated funds and ride them out patiently? Or will there be broader fallout? One worrying scenario is if many such funds for high-net-worth investors suspend redemptions simultaneously (similar to how UK open-ended property funds all gated after Brexit). Investors may have counted these holdings as quasi-cash or low-risk income, only to find they cannot access their money (or the value is suddenly marked down). That could cause re-pricing contagion: if investors forced to stay in want to raise cash elsewhere, they might sell other assets, spreading stress across markets. Alternatively, if some funds attempt to sell assets to meet redemptions, a wave of loan sales could depress loan prices more broadly. The IMF notes that the prominent investors in private credit (insurance firms, pensions) usually have long horizons and can manage capital calls and illiquidity, which should limit systemic risk. However, retail participation is rising, and some funds target shorter-term investors, which could introduce run-like dynamics that historically haven’t been an issue in this space.
In summary, private credit funds offer yield with an illusion of liquidity control—you can’t withdraw easily (which prevents runs most of the time), and you don’t see volatility (which keeps you comfortable). But the mismatch between underlying asset liquidity and investor expectations can become problematic. The traditional assumption was that because these funds lock you in, they avoid the classic run risk of open-ended mutual funds. And generally that’s true: “most private credit funds hold highly illiquid assets, but their structure is designed to minimize liquidity and maturity transformation risk”. Yet the introduction of even limited liquidity means some transformation is happening—and it may be mispriced. Investors might be accepting lower returns for the privilege of a stable-looking investment, not fully appreciating that in a real crisis, their investment could behave just as poorly as risky public assets (only on a lag). We will discuss this further in the next section on the liquidity premium. For now, the key point is: private credit’s stable NAV and limited withdrawals can conceal significant liquidity risk. When stress hits, the choices boil down to forced selling or gating—and both outcomes mean the purported stability was more fragile than advertised. The recent rapid growth of semi-liquid credit funds, which have “more than tripled in size since the end of 2021”, bears close watching. A severe downturn has not truly tested them. The liquidity illusion in private markets is that illiquidity can be neatly packaged away—in reality, it can only be ignored until it inevitably resurfaces.
Classical financial theory posits that investors demand a liquidity premium—an additional expected return—for holding illiquid assets. The idea is straightforward: if you tie up your money or take on assets that can’t be easily sold, you should be compensated for that risk. Historically, private market investments (with multi-year lockups) and less-traded securities have indeed been thought to offer higher returns than comparable liquid assets. For example, private equity and private credit have aimed to outperform public equity and public debt benchmarks, partly on the premise that illiquidity deserves a reward. However, there is growing evidence and argument that this liquidity premium has shrunk dramatically—and may even have flipped sign in some cases. In other words, investors might now be paying (in the form of lower returns or higher prices) for the privilege of illiquidity, under the illusion that it provides stability or diversification.
Cliff Asness provocatively asked this in late 2019: What if the conventional wisdom on illiquidity is backward? “Illiquidity is a bad thing…and you need to be paid extra for taking it on. But what if this is backwards? What if investors will actually pay a higher price and accept a lower expected return for very illiquid assets?”. This notion stems from the observation that many investors prefer illiquid assets for behavioral or cosmetic reasons. If having an asset that doesn’t mark-to-market (and thus doesn’t show losses in bad times) makes it easier for an investor to stay the course, they might willingly accept a lower return. Essentially, they are paying for an “illusion of stability.” Asness notes that for mild levels of illiquidity, the traditional premium might still hold (e.g., a slightly less liquid small-cap stock vs a large-cap stock). However, for extreme illiquidity, such as multi-year lockups with rare pricing, the dynamic can shift—the ability to ignore volatility becomes a service that investors are willing to pay for. Indeed, many institutional investors have invested in private assets despite modest incremental returns, ostensibly because the smoother ride (and perhaps the optics of higher Sharpe ratios using reported data) is more attractive.
Empirical research supports skepticism about the illiquidity premium in private markets. A 2023 analysis by Northern Trust’s CIO of equities found “little evidence” of an actual illiquidity premium in private equity, after adjusting for risk factors. Private equity, he argued, is essentially a leveraged version of small- to mid-cap public equities, supplemented with some active management. Once you account for leverage and the fact that private equity valuations are only quarterly (thus smoothing volatility), any excess return essentially vanishes. Notably, he stated that when private assets are marked-to-market as frequently as public ones, “the liquidity premium disappears… The lack of mark-to-market [pricing] hides it.”. In other words, much of private equity’s perceived outperformance over public equities in calmer periods might have been an illusion created by stale pricing. This aligns with the idea that volatility suppression is being misinterpreted as alpha or extra return, whereas in reality, it’s just a timing/measurement difference.
Furthermore, the illiquidity premium may only exist where investors expect liquidity but are suddenly unable to obtain it. If an asset is known to be illiquid (such as a 10-year lockup fund), investors have already mentally prepared for this, and competition for returns has driven away the extra compensation. By contrast, in public markets, if you buy a small-cap stock assuming you can sell any day, and then discover it’s hard to sell in a downturn, you will demand a premium for that surprise risk. As one expert put it: “I contend that you only get paid an illiquidity premium in markets where you expect liquidity but don’t achieve it… But in PE or real estate, everybody knows you’re in it for the long term… It’s not a mystery.”. This suggests that the classic illiquidity premium lives in parts of the public markets (small caps, distressed credits—assets that typically trade but seize up in crises), rather than in the fully private markets where illiquidity is fully anticipated and priced in. In private markets, what might have once been a liquidity premium has been eroded by the flood of capital seeking those assets, potentially turning it into an “illiquidity discount”—where investors accept lower returns.
Over the past decade, institutional investors have aggressively increased their allocations to private equity, private credit, and real estate, drawn by the higher yields and smoother returns these assets offer relative to low-yield bonds or volatile stocks. This surge of demand (and capital competing for deals) inevitably compressed future returns. For instance, private credit funds today often lend to companies at interest rates not much better (after fees) than what one could get in public high-yield bonds—implying a slim or negative liquidity premium. In some periods, significant private equity funds have outbid strategic buyers for companies, arguably overpaying and thus lowering prospective returns, partly because their investors accept that trade-off for diversification or non-marketed assets. The CAIA Association highlighted this phenomenon, noting that investors have been so enamored with “smoother” returns that they “are willing to pay a hefty fee premium and may even accept a return discount” in exchange for them. In plainer terms, investors are consciously paying up (via high fees and lower net returns) for the benefit of illiquidity—the exact opposite of being paid a premium. This is a profound market shift.
A vivid illustration is the comparison of drawdowns during the Global Financial Crisis. Broad public markets (e.g., small-cap value stocks) fell roughly –60%, whereas the reported drawdown for private equity funds was only about –28%. Does that mean private equity was magically more resilient? Almost certainly not—it reflects the fact that private equity values were not continuously marked down to fire-sale prices. If one assumes the actual economic value of those private companies fell similarly to that of comparable public firms, then private investors did not actually avoid losses—they just avoided seeing a– 60% decline on their statements. If they subsequently accept a lower long-term return (say, getting 10% vs 13% in public markets) because the ride was smoother, they have effectively paid 3% annually for volatility avoidance. This is why Asness dubs it “volatility laundering”—taking volatile assets, hiding the volatility, and charging a fee for it. The critical question he poses is: Are investment committees being told, “We like these investments, even at a potential return discount to comparable liquid investments, because we’ll all be better off in the long term if we just have less information”? It may sound facetious, but it might be true for many: they implicitly accept lower returns as a cost for a more leisurely psychological ride.
All told, the debate over the liquidity premium has shifted. Traditional theory isn’t overthrown—in genuinely apples-to-apples comparisons, illiquid securities should have higher expected returns to compensate for the inconvenience and risk. Specific data (e.g., decades of public small-cap versus large-cap stocks) reveal a positive illiquidity premium. However, in practice, once we move to comparing whole asset classes and factoring in investor behavior, the picture is murkier. Private assets, far from delivering a straightforward illiquidity premium, often appear to offer returns that do not surpass those of public market equivalents on a risk-adjusted basis—and may even lag behind them, once fees and smoothing are factored in. Investors appear to be knowingly trading off liquidity for other perceived benefits (diversification, higher reported Sharpe ratios, access to niche opportunities, etc.), not necessarily for higher raw returns.
It’s worth noting that some segment of investors indeed value illiquidity as a commitment device (to prevent themselves from selling at the wrong time). From that perspective, illiquidity has a utility, almost like buying insurance or hiring a personal trainer to lock you into a regimen. This can rationalize why illiquid funds could charge higher fees and still attract money—the investors aren’t naïve; they want the illiquidity “service.” However, from a purely pricing standpoint, this means the asset yields are lower than they would be otherwise—essentially a negative liquidity premium (or a liquidity penalty that investors incur).
In summary, the traditional liquidity premium may be waning or even reversing in the 2020s. Illiquid private markets were once thought to offer 3–5% extra returns, but as one industry executive predicted, with so much capital flowing in, “My hunch is that it will dissolve… I wouldn’t be surprised to see it disappear.”. We are arguably seeing this now: investors are pouring money into private credit and real estate at yields that, after costs, barely match those of public markets, under the premise that the stability and uncorrelated nature justify it. This illusion can persist so long as volatility stays low. But if those hidden risks materialize, investors may experience lower returns and heavy losses—the worst of both worlds. Thus, liquidity premiums are being mispriced: many private assets may offer too little return for their actual liquidity risk (premium effectively negative), while some public assets might actually carry an undervalued liquidity premium (e.g. certain small-cap or emerging market stocks might have outsized returns because they are shunned for liquidity reasons—a case where illiquidity is rewarded, because investors mistakenly expect more liquidity than is there).
For asset allocators, this calls for a reevaluation: don’t assume you’re getting paid a premium for locking up funds—check the data. In many cases, you might be forgoing a return for the sake of illiquidity. As Asness wryly concluded, that doesn’t have to be “wrong”—if it helps investors stick with a plan, it might be worth it—but it should be “generally accepted as a cost”, not glossed over. The following section will compare the liquidity risks of public ETFs vs private credit side by side. Then we’ll discuss how a CIO or allocator can adapt their strategy in light of these mispricings.
It is helpful to compare the liquidity characteristics and risks of a public ETF with those of a private credit fund. Each carries very different structures and investor experiences under stress. Table 1 provides a high-level comparison of key liquidity risk factors in ETFs (public markets) versus private credit funds (private markets):
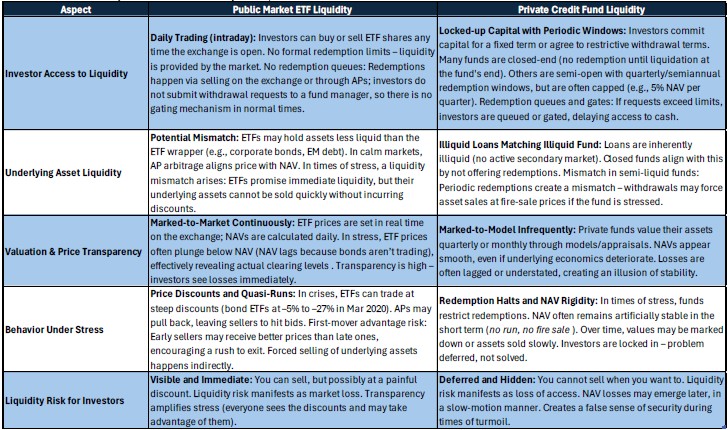
As shown above, ETFs offer liquidity on demand in structure, but not always in economic reality. In contrast, private funds offer liquidity by appointment (or not at all), which can protect the fund at the expense of investor flexibility. Neither is automatically “better”—each entails trade-offs. In an ETF, you have the freedom to transact, but you also bear the brunt of price swings and possible discounts in a crunch. In a private fund, you relinquish some liberty, which can prevent panic selling, but you’re exposed to the manager’s discretion and the hope that eventual outcomes are favorable. One could say that ETFs externalize liquidity risk (by incorporating it into the market price), while private funds internalize it (through control mechanisms established in fund terms). Importantly, in both cases, the underlying asset risk remains the same—a portfolio of risky loans is still a portfolio of risky loans, whether in an ETF or a private fund. However, how that risk translates into the investor’s experience during stress differs vastly.
From the perspective of an asset allocator, the insights above call for a more nuanced approach to liquidity risk management. The traditional buckets of “liquid vs illiquid” need refinement: not all “liquid” assets will remain so under duress, and not all “illiquid” assets compensate you for being locked up. Below are key implications and recommendations for institutional investors and wealth managers:
In essence, liquidity risk must be at the forefront of portfolio management in the coming years. The experiences of 2020 and 2022 have made it clear that things assumed to be liquid can falter. CIOs should question rosy assumptions: If 30% of our portfolio is in “alternative” assets, do we really have 70% liquid—or is some of that 70% going to behave illiquid too in a crunch? Often, traditional 60/40 portfolios were assumed to be entirely liquid; however, if the 40% in bonds is held through vehicles like mutual funds or ETFs, which can experience issues, even a “liquid” 60/40 portfolio has hidden liquidity risk. It may be prudent to assign a liquidity risk score to each asset class and set limits for the portfolio. Additionally, effective communication and expectation management are crucial—boards and clients should be informed that ETF liquidity can be illusory and private asset valuations are not absolute. By resetting expectations, a CIO can avoid reactionary decisions by stakeholders in the heat of a crisis (“Why can’t we get our money out? Why is our bond ETF down 30%?”).
Finally, consider advocating for or utilizing structural risk mitigants: for example, some bond funds now use swing pricing (adjusting NAV for redemption costs) to deter runs, and some ETFs are exploring mechanisms to ensure better liquidity in stress (like baskets that prioritize liquid assets). While these are industry-level issues, as an allocator, you can favor managers who are prudent about liquidity (e.g., a private credit fund that maintains a higher cash buffer or has longer lock-ups aligned with its assets may be safer than one that promises too much liquidity).
In summary, the investment implication is a shift in mindset: treat liquidity as a finite resource that commands a premium—and recognize where the market isn’t charging that premium appropriately.
Discount apparent liquidity that may not be there in a crunch, and don’t overpay (or over-allocate) for illiquidity under the false belief it’s giving you magic diversification. As one asset manager noted, a crowded theater with a narrow exit can be a dangerous situation. The role of the CIO is to ensure your portfolio can either avoid the stampede or, at least, not be the last one trying to squeeze through the exit.
In the low-volatility, liquidity-fueled environment of the 2010s, investors grew accustomed to easy trading and the comforting stability of private assets. The lessons of 2008 faded as central banks backstopped markets, and cash was plentiful. However, as we navigate the 2020s, liquidity (or rather, its sudden absence) is re-emerging as a central risk—arguably one of the defining financial risks of this decade. We have already had two wake-up calls: the March 2020 dash for cash and the 2022 UK gilts turmoil. These events exposed cracks in the assumed liquidity of both public and private instruments. In the future, multiple factors could continue to stress liquidity: the unwinding of ultra-easy monetary policy (quantitative tightening draining excess liquidity), higher interest rates (making investors less tolerant of lockups and more prone to redeem), growth of less-regulated liquidity transformation (ETFs, open-end private funds, etc.), and simply the unknown contours of the next crisis (which could force selling in new areas).
The concept of liquidity illusion encapsulates a systemic vulnerability: modern financial markets have engineered many products that appear to offer liquidity or stability, but in truth rely on benign conditions. When those conditions flip, everyone may rush for liquidity that isn’t there. As the European Central Bank cautioned in a recent report, the opaqueness and growth of private markets could pose financial stability risks, including potential contagion channels if investors all attempt to exit en masse or if fund leverage plays a role. Meanwhile, in public markets, the increasing dominance of passive vehicles and algos means liquidity can concentrate and vanish suddenly (as seen in equity “flash crashes” and bond market air pockets). The DTCC (Clearing Corp) in 2018 listed ETF growth and its liquidity dynamics as potential sources of systemic risk, precisely because of the concern that the mechanism may falter in extreme stress.
For the remainder of the 2020s, we can expect liquidity (or its absence) to remain a recurring theme in market dislocations. Whether it’s a credit cycle turn that tests private credit fund outflows, a geopolitical shock that freezes parts of the bond market, or a tech-driven run (even crypto markets have shown liquidity illusions, with “stablecoins” breaking pegs due to illiquidity), the illusion will be tested repeatedly. Each time, those holding the bag—thinking they could get out or that their asset is rock-solid—may face hard lessons.
However, recognizing this risk is the first step toward mitigation. Regulators are actively working on measures, such as the SEC’s new rules on open-end fund liquidity and swing pricing, European regulators’ consideration of liquidity stress tests for funds, and discussions about AP transparency in ETFs. Central banks have also made clear they won’t always ride to the rescue; moral hazard is a concern. Hence, investors should not count on a Fed or BoE bailout of liquidity every time (2020 and 2022 notwithstanding). A forward-looking thesis is that those who proactively manage liquidity risk will navigate the 2020s far better than those who don’t. This means demanding appropriate premiums for illiquid investments (or avoiding them if premiums are insufficient), layering portfolios with genuine liquidity for bad times, and being opportunistic when others are caught in illusions.
In conclusion, the “liquidity illusion”—the gap between perceived and actual liquidity—is indeed shaping up to be a defining challenge of this decade. It lurks in the popular ETF that works flawlessly until the day it doesn’t, and in the private credit fund that seems solid until everyone wants their money out. It will require investors to exhibit humility and diligence to avoid complacency. As liquidity ebbs and flows (often in sudden jolts), markets will rediscover the age-old truth: liquidity is a fair-weather friend, disappearing when you need it most. By acknowledging this reality, pricing it into decisions, and preparing for its disappearance, we can blunt the impact of liquidity traps. Those who continue assuming “liquidity when I want, stability when I don’t” may find the 2020s a very bumpy ride.
The liquidity illusion forces a return to fundamentals: Know what you own, know how you can get out (if at all), and never assume an asset is safer or more liquid than it truly is. Suppose the last decade was about stretching for yield and embracing complexity. In that case, the coming years may well be about examining the liquidity underpinnings of every investment and not taking them for granted. In the end, liquidity is a form of risk like any other, and mispricing it can be just as harmful as mispricing credit or equity risk. The sooner investors correct that mispricing, the more resilient their portfolios will be in the face of whatever comes next. As one commentary on markets noted, when central bank support fades and liquidity “leaves the markets,” those latent vulnerabilities can quickly ignite a crisis. We have been warned; now it’s on us to act accordingly.
Disclaimer: Securities are offered through Purshe Kaplan Sterling Investments, Member FINRA/SPIC headquartered at 80 State Street, Albany, NY 12207. Investment Advisory Services offered through PWW LLC, an SEC Registered Investment Adviser. Investment Advisory services are provided through Ignite Planners, LLC. Purshe Kaplan Sterling Investments and Ignite Planners, LLC are not affiliated companies. Ignite Planners, LLC only transacts business in states where it is properly registered or is excluded or exempted from registration requirements. SEC registration does not constitute an endorsement of the firm by the Commission and does not imply that the advisor has achieved a particular level of skill or ability. All investment strategies carry the potential for both profit and loss.
The information presented is believed to be current. It should not be viewed as personalized investment advice. All expressions of opinion reflect the judgment of the presenter on the date of the presentation and are subject to change. All investment strategies have the potential for profit or loss. Asset allocation and diversification will not necessarily improve an investor’s returns and cannot eliminate the risk of investment losses. Target allocations can deviate at any given time due to market conditions and other factors. There can be no guarantee that an investment or strategy will be suitable or profitable for an investor’s portfolio. Different types of investments involve higher and lower levels of risk.
Charts and slides do not represent the performance of Atlas Investment Management or any of its advisory clients. Historical performance returns for investment indexes and/or categories usually do not deduct transaction and/or custodial charges or an advisory fee, which would decrease historical performance results. There are no guarantees that an investor’s portfolio will match or outperform a specific benchmark.
This communication, including attachments, is for the exclusive use of the addressee and may contain proprietary, confidential, or privileged information. If you are not the intended recipient, any use, copying, disclosure, dissemination, or distribution is strictly prohibited. Please notify the sender immediately by return email, delete this communication, and destroy all copies.